Microsoft Underground Tour: Research projects uncovered
By Ryan Noik 11 November 2016 | Categories: news
Related Articles

The Microsoft Underground Tour, held at Microsoft’s headquarters in Redmond, Washington, started taking a more pragmatic direction, as we were shown a few of the research projects that Microsoft has produced. Ryan Noik takes a closer look.
The second part of the behind the scenes look at Microsoft Research focused on practicalities, with the potential of predicting weather phenomena, the future of growing food and placing data centres in unexpected locations being among some of the standouts.
Those mysterious screens that were scattered around the room turned out to be demo stations, with each highlighting a particular project that was in progress or had already come to fruition.
Data reimagined
The first of these, NUI Graph, centred around data visualisation, using an all too familiar application, Microsoft Excel, in a very unfamiliar way. It was also a pIeasant surprise, as personally I am one of those people who loathes spreadsheets. NUI Graph, which is still in a prototype stage, actually made them considerably more interesting, converting the usual rows of numbers and text into tetris like blocks and a three dimensional visual form.
Dave Brown, the senior research software development engineer, proceeded to show us how any spreadsheet, the one in the example focusing on tornadoes, could be brought to life, fostering understanding of data so as to glean insight in a user friendly way. More particularly, the instances of tornadoes showed as 3D, coloured columns, and information could be displayed according to geographic region, month, year, day and even time.
This meant that suddenly a spreadsheet became a visual storytelling tool, and quickly showed that in the United States, the most number of tornadoes occurred in June and July, with unexpectedly. Switching to a geographic view instantly showed that Colorado is one of the states most likely to be beset by them, with the late afternoon being the worst time of day to be outdoors during those months if you wanted to avoid being struck by nature’s fury.
While this was applied to natural phenomena, Brown explained that it had application on any type of spreadsheet where a good amount of data is collated. “Our goal is to allow people to spot the patterns and drill down to find out why things are happening,” he elaborated.
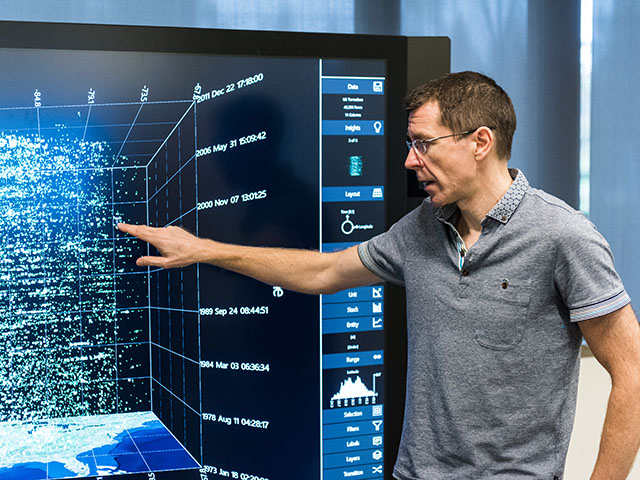
Dave Brown, senior research software development engineer, Microsoft Research.
Data in the (not so) deep blue sea
The next demo focused on data centres as we haven’t seen them before - underwater. Project Natick consists of a self contained capsule, somewhat resembling a tiny submarine, with a data centre inside of it, and answers the problem of where to put data centres, particularly as reliance on the cloud only becomes more prominent. Microsoft Research’s answer? Why not try the ocean, considering that 70% of the planet consists of water.
The team thus submerged its sealed capsule off the coast of Santa Barbara, in shallow water (15 metres) for a period of three months. Eric Peterson, the principal mechanical architect, and Spenser Fowers, the technical staff member on the project, explained that the reasoning behind Project Natick – which was the brainchild of an employee who used to work in the Navy – is that half of the world lives within 200 km of the ocean. Additionally, it offers a solution to the often vexing problem associated with keeping data centres cool.
Jeff Kramer, technical staff member, elaborated that there are other advantages to this approach as well, explaining that factors such as oxygen and humidity, which normally reduces the lifespan of servers, are no longer an issue, which results in efficiency gains. Additionally, as water is denser than air, considerably less water is required to cool the system than its land-bound counterpart.
While the prototype was submerged in shallow water, future iterations are envisioned to be immersed in the ocean and left there for three to five years, with the appropriate fail safe measures already in place.
The future of food
It was then time for food – not to eat, but rather to see how produce may be grown in the future. The next project focused on just that, while exploring the convergence of art, biology and technology.
Project Florence was simply fascinating. The first part of the project entailed speaking to a plant, as a typed sentiment was converted into either blue (positive) or red (negative) light. The plant’s state was then translated using an algorithm, with the plant constructing a sentiment from Twitter (greeting a plant by typing hello beautiful elicited a response comparing me to the light of the moon).
Asta Roseway, the principal research designer, explained that there has always been a relationship between people and their gardens (with some sources linking these relationships to increased longevity) but with computer interaction, plants would be able to talk back. This could have particular implementation in education and encouraging children to grow their own gardens and food.
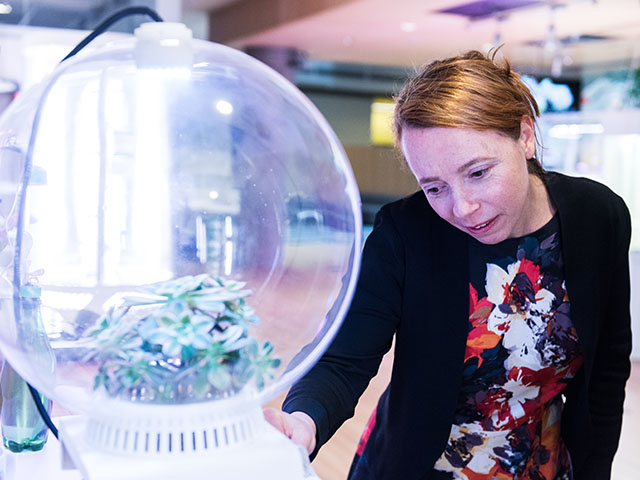
Asta Roseway, principal research designer, Project Florence
There is a more pressing aspect to the project, which takes a speculative look at the state of the planet in 2050. Roseway explained that it is largely expected that population growth, climate change, soil erosion and growing populations in cities would make urban farming (growing food indoors, in tanks) more essential. We were then shown two tanks, side by side, one containing fish and the other plants, and each connected. She elaborated that the company has leveraged aquaponics, which uses fish to generate nitrogen, which in turn is used by the plants for their nutrients. The plants in turn ‘clean’ the water in which the fish live, creating a nearly self sustaining system. The result is some 6 800 kg of lettuce grown using this method, and served in the Microsoft campus cafes.
The third piece of the project was then the technology side, which sees a myriad of sensors deployed in the fish tank and amongst the plants. With these, Microsoft Research is able to monitor the health of the system and pump data into cloud analytics to map their sensors to the end yield.
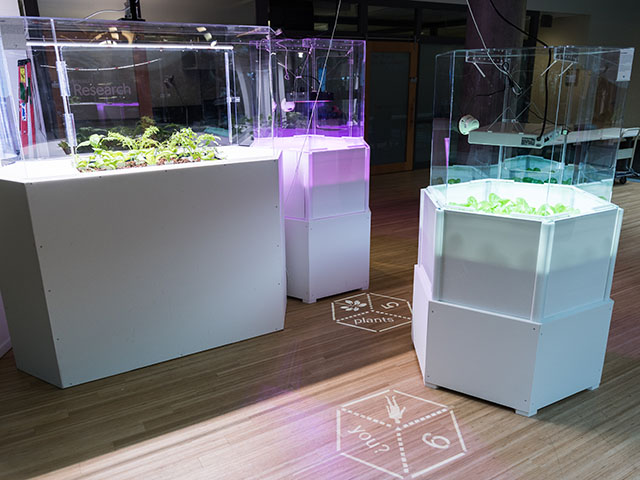
Paul Johns, the senior research design engineer explained that it is then able to determine how different chemical patterns are better for different yields. “We are trying to find those algorithms to apply machine learning to crop production,” he noted. Johns elaborated that one of the unexpected findings of the project is that plants not only grow considerably faster in a contained environment than in a home garden (which is important when crop yield becomes imperative) but that they also move a lot, despite there being no wind in the tanks.
“This project is a really great example of how we can bridge across disciplines and work together on a common problem set,” he enthused.
Our time with Microsoft Research may have been over, but our behind the scene’s look at the inner workings of Microsoft was actually just beginning. Still ahead was a more intimate look at how products are manufactured, the quietest room in the world, and an alluring glimpse at the future.
Most Read Articles

Have Your Say
What new tech or developments are you most anticipating this year?
